

RPSC RAS / RTS · Module 52 · Mains depth · 20 min
Impacts of climate change: heat, monsoon, ice, seas and coral
What RPSC RAS / RTS asks from this chapter
Syllabus lines this chapter covers:
- General Knowledge and General Science · World geography: mountains, plateaus, plains and deserts; major rivers and lakes; natural vegetation; agriculture and crops; industrial regions; transport; desertification, deforestation, climate change and ozone depletion.
- General Knowledge and General Science · Environmental and ecological changes, biodiversity and conservation; agriculture, horticulture, forestry and animal husbandry in Rajasthan; science and technology programmes of Rajasthan and India; recent advances and contribution of Indians.
- General Studies II · Biology: the cell, plants and their nutrition, reproduction, human physiology, nutrition, immunity and diseases, microbes and fermentation, biotechnology and GMOs, vaccines, CRISPR, mRNA and artificial organs.
RPSC RAS / RTS questions from this module are being sorted into our bank.
Read at full depth: basics, the standard layer and the Mains analysis.
Start from zero: one fever, many symptoms
When a person has a fever, the thermometer shows only one number. But the fever shows up in many ways: headache, weakness, loss of appetite, and sometimes damage to organs. Doctors treat the cause, but they also watch every symptom.
Global warming is the planet's fever, and the rise in average temperature is the thermometer reading. The symptoms are what people actually feel: hotter heatwaves, a less reliable monsoon, shrinking glaciers, rising seas, warmer and more acidic oceans, and dying coral reefs. These are the impacts of climate change.
A small rise in the average can cause large changes in the extremes. A world that is on average only a little warmer has many more very hot days, just as a slightly higher body temperature can make someone very ill. This is why scientists speak of every tenth of a degree.
This chapter goes through the symptoms one by one, first for the world and then for India. For each one it explains what is happening, why it happens, and what it means for people. That last part is what Mains questions usually ask for.
Heat: hotter days and harsher heatwaves
Imagine a bell-shaped curve of daily temperatures, with most days in the middle and a few very hot or very cold days at the edges. Warming shifts the whole curve to the right. The middle moves only a little, but the number of days in the hot tail grows sharply.
That is why the IPCC concluded that every additional 0.5 °C of global warming causes clearly discernible increases in the intensity and frequency of hot extremes, including heatwaves. Heat is now the most direct and widely felt impact. The World Meteorological Organization reported that 2024 was the warmest year in its 175-year record, about 1.55 °C above the 1850–1900 average.
India's record. India's surface air temperature rose by about 0.7 °C during 1901–2018. That may sound small, but it is an average over all seasons and regions. The real damage comes from more frequent and longer heatwaves in the pre-monsoon months.
India's future. Under a high-emission scenario, India's average temperature is projected to rise by about 4.4 °C by the end of the century, compared with 1976–2005. Summer heatwaves from April to June are projected to become 3 to 4 times more frequent. Lower emissions would mean much smaller rises, which is the main argument for mitigation.
Why this matters. Heat kills directly, especially outdoor workers, the elderly and people in crowded cities. It also cuts labour productivity, raises electricity demand for cooling and damages crops such as wheat during their grain-filling stage. Cities trap extra heat in concrete and asphalt, so urban heat adds to the problem.
Water: a monsoon that is less reliable
Warm air can hold more water vapour. So a warmer world does not simply become wetter or drier. It makes the water cycle more vigorous: when it rains, it can pour, and between rains, dry spells can be longer.
What has happened in India. India's summer monsoon rainfall (June–September) declined by about 6% from 1951 to 2015, with notable decreases over the Indo-Gangetic Plains and the Western Ghats. At the same time, dry spells were 27% more frequent in 1981–2011 than in 1951–1980. Droughts also became more frequent and covered larger areas during 1951–2015.
The other side of the same coin is localised heavy rain. Short, intense downpours have become more frequent even as the total monsoon has weakened in some regions. This combination of more dry days and more extreme wet days is the signature of a disturbed monsoon.
Why this matters for India. Much of Indian farming is still rain-fed, so the timing of rain matters as much as the total. A long dry spell at sowing time or a cloudburst at harvest can ruin a crop. Heavy rain on hard, dry ground also runs off quickly, causing urban and flash floods while recharging little groundwater.
Changes in rainfall and soil moisture therefore affect food production, which can lead to shortages, malnutrition and higher food prices. They also strain reservoirs, hydropower and drinking-water supply. Planning for water now has to assume more uncertainty than before.
Ice: shrinking glaciers and vanishing sea ice
Glaciers are slow rivers of ice that build up from snow in cold seasons and lose ice in warm ones. When the climate warms, they lose more than they gain, and their fronts retreat uphill. They are among the clearest thermometers in nature.
The IPCC found that the global retreat of glaciers since the 1950s is unprecedented in at least the last 2,000 years. It also found that human influence is the main driver of the worldwide retreat of glaciers since the 1990s. At the top of the world, late-summer Arctic sea ice is now smaller than at any time in at least the past 1,000 years.
Why this matters for India. The Himalayan glaciers feed the Ganga, the Brahmaputra and the Indus, which support hundreds of millions of people. In the short run, faster melting can raise river flows and create new glacial lakes, which may burst and cause floods. In the long run, shrinking glaciers mean less meltwater in the dry season, exactly when farms and cities need it most.
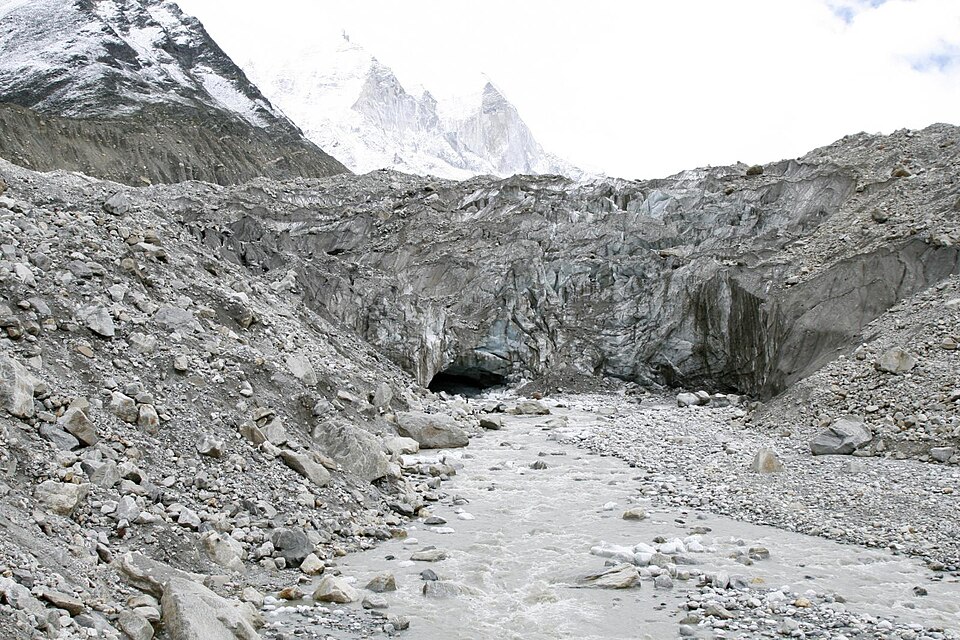
A feedback, not just a symptom. White ice reflects sunlight, while dark ocean water absorbs it. As Arctic sea ice melts, more dark water is exposed, it absorbs more heat, and more ice melts. This is the ice-albedo feedback, which helps explain why the Arctic is warming faster than the global average.
Seas: rising, and rising faster
Sea level rises for two main reasons. First, water expands as it warms, so a warmer ocean takes up more space. Second, melting land ice from glaciers and ice sheets adds new water to the ocean.
The IPCC found that global mean sea level rose by 0.20 m between 1901 and 2018. More worrying is the speed. The average rate was 1.3 mm a year in 1901–1971, rose to 1.9 mm a year in 1971–2006, and reached 3.7 mm a year in 2006–2018, almost three times the early rate.
India's seas. The north Indian Ocean rose at 1.06–1.75 mm a year during 1874–2004. In recent decades the rate has jumped to about 3.3 mm a year (1993–2017), close to the global pace. India's long and densely populated coastline, with major cities and fishing communities, is therefore exposed.
Why a few millimetres matter. A higher sea level lets storm surges from cyclones reach further inland. Salt water seeps into coastal groundwater and farmland, making it unfit for drinking or crops. Low-lying deltas and islands, such as the Sundarbans and many small island states, face the greatest risk of losing land and homes.
Oceans: the planet's heat sink, turning sour
The ocean is the main store of the extra heat trapped by greenhouse gases. The IPCC found that ocean warming accounted for 91% of the heating in the climate system in recent years. The air has warmed less than it would have, because the sea has been quietly absorbing most of the heat.
Closer to home, the surface of the tropical Indian Ocean warmed by about 1 °C during 1951–2015. Warmer seas hold less oxygen, push fish towards cooler waters and feed more energy into cyclones. This links ocean warming to fisheries, coastal livelihoods and disasters.
The ocean also absorbs a large share of the carbon dioxide we emit. When CO2 dissolves in seawater it forms a weak acid, so the water becomes slightly less alkaline. This is ocean acidification, and the IPCC says human CO2 emissions are its main driver.
The change is already historic. Open-ocean surface pH as low as in recent decades is unusual in the last 2 million years. More acidic water makes it harder for corals, shellfish and tiny plankton to build their calcium carbonate shells and skeletons, which threatens food webs from the bottom up.
Coral reefs: the first ecosystem in the firing line
A coral reef is built by tiny animals called coral polyps. Inside their tissue live microscopic algae that make food by photosynthesis and share it with the coral. The algae also give corals most of their colour.
When the sea stays too warm for too long, this partnership breaks down. The stressed coral expels its algae and turns white, showing its limestone skeleton. This is coral bleaching. A bleached coral is not yet dead, but if the heat lasts, it starves and dies.
Warming and acidification hit corals together: heat causes bleaching, and more acidic water weakens their skeletons. The IPCC's special report on 1.5 °C projected that coral reefs would decline by a further 70–90% at 1.5 °C of warming, and by more than 99% at 2 °C. This is the clearest example of why half a degree matters.
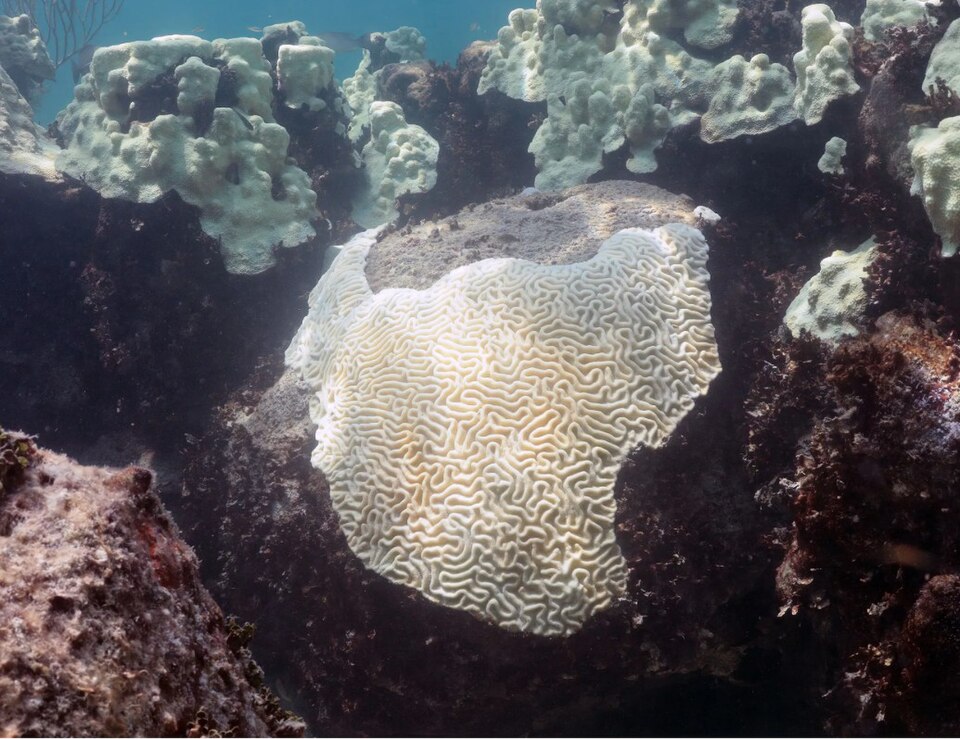
Why this matters. Reefs cover a tiny part of the ocean floor but shelter a very large share of marine species. They protect coasts by breaking waves, support fisheries and tourism, and are a source of medicines. India's reefs in the Gulf of Mannar, the Gulf of Kachchh, Lakshadweep and the Andaman and Nicobar Islands face the same threat.
People: food, health, homes and fairness
All these physical changes finally land on people. The IPCC's impacts report found that about 3.3 to 3.6 billion people live in contexts that are highly vulnerable to climate change. That is close to half of humanity.
Food. Heat stress, erratic rain and changing soil moisture reduce crop yields and quality. Lower output can lead to shortages, malnutrition and rising food prices, which hurt the poorest families most. Fisheries also suffer as warmer seas push fish away and reefs decline.
Health. Heatwaves cause heatstroke and deaths. A warmer climate can widen the range and season of diseases carried by mosquitoes, such as malaria and dengue, and floods spread water-borne diseases. Air pollution and heat together make breathing harder for children and the elderly.
Homes and livelihoods. Floods, cyclones and sea-level rise destroy homes, roads and farms. When land or water fails, people are forced to migrate, often to crowded city slums. Economies that depend on climate-sensitive sectors such as agriculture and forestry, as India's does, carry a higher risk.
Fairness. The people most exposed, such as small farmers, fishers, the urban poor and tribal communities, have contributed least to the problem. This gap between who causes the damage and who suffers it is the heart of the climate justice debate.
Mains lens: writing about impacts with evidence
Impact questions are common, and weak answers list "floods, droughts, sea-level rise" without evidence. Strong answers use a few precise numbers and show the chain from cause to consequence. Four habits help.
1. Observed, then projected. Start with what has already happened (India +0.7 °C in 1901–2018, monsoon −6% in 1951–2015, sea level 3.3 mm a year), then give projections (4.4 °C and 3–4 times more heatwaves under high emissions). This shows the examiner that you know the difference.
2. Sector by sector. Organise impacts by sector: agriculture, water, health, coasts, ecosystems and the economy. For each, add one line on who is hit hardest, such as rain-fed farmers or coastal fishers. This turns a list into an analysis.
3. Half a degree matters. Use the coral figures (70–90% loss at 1.5 °C, over 99% at 2 °C) and the IPCC finding on every extra 0.5 °C. They justify why the 1.5 °C goal is worth fighting for.
4. End with response, not despair. Close with adaptation (heat action plans, drought-resistant crops, early warning, coastal protection) and mitigation (cutting emissions). An impacts answer that ends with a way forward always scores better.
Mains practice: six questions, six angles
These are practice questions written by us, not past papers. Past questions from each exam appear in the PYQ panel of this module.
| Angle | Question | Key points to cover |
|---|---|---|
| India | Discuss the observed and projected impacts of climate change on India. | Give observed figures for temperature, monsoon, dry spells and sea level, then the projections for 2100. Organise by sector and end with adaptation. |
| Monsoon | How is climate change altering the Indian monsoon? What does this mean for agriculture? | Explain the more vigorous water cycle, the 6% decline, 27% more dry spells and more localised heavy rain. Then link these to rain-fed farming, groundwater and food prices. |
| Oceans | Explain ocean warming and ocean acidification. How do they threaten marine ecosystems and coastal livelihoods? | Use the 91% heat share, the 1 °C Indian Ocean warming and the 2-million-year pH finding. Then cover corals, shellfish, fish movement and cyclones. |
| Ice and sea | Why is sea-level rise accelerating? Assess its implications for India's coastal regions. | Explain thermal expansion and land-ice melt, and the rise in the rate from 1.3 to 3.7 mm a year. Then cover storm surges, salinity, deltas and coastal cities. |
| Ecosystems | "Coral reefs are the canaries of climate change." Explain. | Explain the coral–algae partnership and bleaching, then the 70–90% and 99% projections. End with India's reef areas and protection measures. |
| Justice | "Those who contributed least to climate change suffer the most." Discuss with Indian examples. | Use the 3.3–3.6 billion vulnerable figure and the difference between exposure and vulnerability. Then give examples of farmers, fishers and the urban poor, and suggest targeted adaptation. |
How to use this table: each answer should first explain the what, then give the why from this chapter, and end with a way forward.
Quick revision
- Every extra 0.5 °C clearly raises the intensity and frequency of hot extremes; 2024 was the warmest year on record, about 1.55 °C above 1850–1900.
- India: +0.7 °C (1901–2018); projected about 4.4 °C by 2100 under high emissions; summer heatwaves 3–4 times more frequent.
- Monsoon: about −6% (1951–2015), mainly the Indo-Gangetic Plains and Western Ghats; dry spells +27% (1981–2011 vs 1951–80); more droughts and more localised heavy rain.
- Ice: glacier retreat since the 1950s is unprecedented in 2,000 years; Arctic late-summer sea ice is the lowest in 1,000 years.
- Sea level: +0.20 m (1901–2018); rate 1.3 → 1.9 → 3.7 mm a year; north Indian Ocean about 3.3 mm a year (1993–2017).
- Oceans: 91% of the extra heat; Indian Ocean +1 °C (1951–2015); pH this low is unusual in 2 million years.
- Corals: a further 70–90% loss at 1.5 °C, over 99% at 2 °C; bleaching = corals expel their algae.
- People: 3.3–3.6 billion highly vulnerable; food, health (malaria, dengue), migration and climate justice.