

UKPSC Lower PCS · Module 40 · standard depth · 16 min
Global warming: the evidence, the feedbacks and the sources
What UKPSC Lower PCS asks from this chapter
Syllabus lines this chapter covers:
- Prelims: General Studies (100) and General Aptitude Test (50) · Geography and Demography of India: broad understanding of geographical, ecological and socio-economic aspects and demography of India.
- Mains: General Studies Paper I · General science, technology and environment.
UKPSC Lower PCS questions from this module are being sorted into our bank.
Cut to standard depth for UKPSC Lower PCS. 8 deeper paragraphs are in the full chapter.
Start from zero: how do we know the Earth has a fever?
When a child feels unwell, a mother does not just guess. She puts a thermometer under the child's tongue and reads the number. If the number keeps rising day after day, she knows that something is wrong, and she starts looking for the cause.
Scientists treat the Earth in the same way. You already know that greenhouse gases keep the Earth warm, like a blanket. So the real questions are simple: is the blanket getting thicker, how much warmer has the Earth become, and where are the extra gases coming from?
To answer them, we will look at three kinds of evidence. First comes the air itself, measured on a mountain in Hawaii since 1958. Then come the temperature records, and finally the everyday activities that release the gases.
Measuring the change: the Keeling Curve
How do we know the blanket is getting thicker? Because scientists have measured it, carefully, every day, for decades.
Before the factories. Air bubbles trapped in old ice tell us what the air was like long ago. They show that before the Industrial Revolution began in the mid-1700s, carbon dioxide in the air was about 280 parts per million (ppm) or less.
"Parts per million" simply means: out of every million molecules of air, about 280 were CO2. It sounds tiny, and it is, but remember that tiny amounts of greenhouse gases decide the Earth's temperature.
A man on a volcano. In March 1958, a scientist named Charles David Keeling, of the Scripps Institution of Oceanography, began measuring CO2 at Mauna Loa, a volcano in Hawaii, high above the dust and smoke of cities. Because the readings never stopped, they form the longest record of direct measurements of CO2 in the atmosphere.
When the readings are plotted, they make a famous rising zig-zag line called the Keeling Curve. By 1958 the global level was already about 315 ppm.
Why the zig-zag? Every year the line goes up and down a little. In the northern hemisphere's spring and summer, plants grow and take in CO2, so the level dips.
In autumn and winter, leaves fall and rot, releasing CO2, so the level rises. The Earth seems to "breathe" once a year. But the overall line climbs steadily, year after year.
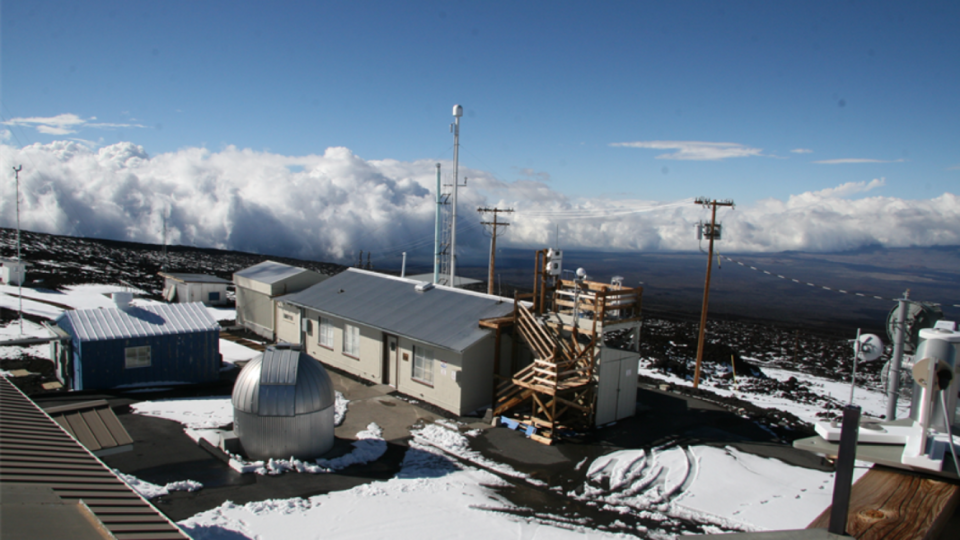
Where we reached. The IPCC's AR6 report gives the levels for 2019:
- CO2: 410 ppm
- methane: 1866 parts per billion (ppb)
- nitrous oxide: 332 ppb
AR6 says CO2 in 2019 was higher than at any time in at least 2 million years, and methane and nitrous oxide were higher than at any time in at least 800,000 years. Since then the level has kept rising every year.
Why this matters. For Prelims, remember Mauna Loa, Keeling, 1958 and the units (ppm for CO2, ppb for methane and nitrous oxide). For Mains, the Keeling Curve is the cleanest evidence that the rise in CO2 is steady and human-driven, and the "2 million years" line shows how unusual today's air is.
How much has the Earth warmed so far?
If the blanket is thicker, the Earth should be warmer. Is it? Scientists compare today with a baseline period, 1850 to 1900, which is the earliest time with enough thermometer records around the world. This is what people mean by "pre-industrial" in climate talks.
The headline number. The IPCC's AR6 report found that the global surface temperature in 2011–2020 was 1.09 °C higher than in 1850–1900 (with a likely range of 0.95 to 1.20 °C). You will often see this rounded to "about 1.1 °C".
"Only one degree? That's nothing!" This is the most common reaction, so let us think about it from first principles.
- When you have a fever of 37 °C going to 39 °C, the change is only 2 degrees, yet your whole body suffers. Small changes in the average of a large system matter a lot.
- A global average of about 1 °C hides much bigger changes in some places and seasons. Land warms faster than oceans, and the polar regions warm faster still.
- The extra heat goes somewhere: into melting ice, into warming the oceans, into more energy for storms and heatwaves.
The oceans are rising. AR6 also found that the global mean sea level rose by 0.20 metres (about 20 cm) between 1901 and 2018. This happens for two reasons: water expands when it warms (just as milk rises when heated), and melting glaciers and ice sheets add water to the sea. For a country like India, with a long coastline, low-lying deltas such as the Sundarbans, and cities like Mumbai, Kolkata and Chennai on the coast, this is a serious concern.
Why 1.5 °C and 2 °C keep appearing. The Paris Agreement states its temperature goal against this same pre-industrial baseline. So when you read that the world has warmed by about 1.1 °C, the gap left to 1.5 °C is small, which is why the next decade's actions are often called decisive.
Why this matters. Prelims may test the baseline period (1850–1900) and the order of magnitude of warming and sea-level rise. Mains answers on climate change are stronger when they open with one or two IPCC numbers, quoted accurately with the report name.
Feedbacks: when warming causes more warming
Have you seen a microphone placed too close to a loudspeaker? A small sound goes into the mic, comes out louder from the speaker, goes back into the mic, comes out even louder, and soon there is a terrible screech. That is a feedback loop: the output feeds back into the input and makes it bigger. The climate has loops like this too.
Feedback 1: water vapour. Warmer air can hold more water vapour. Water vapour is itself a greenhouse gas. So:
- CO2 warms the air a little;
- warmer air holds more water vapour;
- more water vapour traps more heat;
- the air warms a little more. This is why scientists describe water vapour as a feedback that adds to warming already under way, rather than as the original cause.
Feedback 2: ice and albedo. Recall albedo, the share of sunlight a surface reflects: bright snow and ice reflect a large part of the sunlight that falls on them. Now imagine the Arctic sea ice melting in summer:
- warming melts some white ice;
- the dark ocean below is exposed;
- dark water absorbs much more sunlight than white ice;
- the ocean warms and melts even more ice. The same thing happens on mountains when snow cover shrinks.
Feedbacks can also slow things down. Not every loop speeds up warming. For example, plants grow faster in some places with more CO2 and take some of it back. Clouds can both cool (by reflecting sunlight) and warm (by trapping heat), which is why they are one of the hardest parts of climate science.
Tipping points (Mains idea). If a feedback becomes strong enough, a system may cross a threshold and change to a new state that is hard to reverse, like a chair that tips over once leaned back too far. Scientists discuss possible tipping points such as the loss of ice sheets or the drying of large forests. For Mains, use this idea to explain why "a small change now" can mean "a large, lasting change later", without quoting uncertain numbers.
Why this matters. Prelims can test whether water vapour is a cause or a feedback, and the link between melting ice and albedo. In Mains, feedbacks explain why delay is costly: the longer warming continues, the more these loops add to it.
Where the extra gases come from
Look around your own day and you will find greenhouse gases almost everywhere.
Energy: the biggest tap. Electricity from coal-fired power plants, petrol and diesel in vehicles, and fuel burnt in factories all release carbon dioxide. Coal, oil and natural gas are called fossil fuels because they formed from plants and animals buried millions of years ago. That carbon was locked underground; burning it releases it into the air in a few seconds.
Forests: a sink turned into a source. Trees take in CO2 as they grow and store the carbon in their wood. A forest is therefore a carbon sink.
When forests are cleared or burnt, the stored carbon goes back into the air. That is why protecting and growing forests appears in every climate plan, including India's promise to create an extra carbon sink through more forest and tree cover.
Farms and food.
- Flooded paddy fields release methane, because bacteria in waterlogged soil, without oxygen, produce it.
- Cattle, buffaloes, sheep and goats produce methane while digesting grass in their stomachs.
- Nitrogen fertilisers like urea, used in excess, release nitrous oxide from the soil.
Waste. Rotting garbage in landfills and untreated sewage produce methane.
Industry and cooling. Making cement releases CO2 from the limestone itself, not only from fuel. Refrigerators and air-conditioners use fluorinated gases (HFCs), which can leak.
The Kyoto "basket". When countries first agreed to cut emissions under the Kyoto Protocol (adopted in 1997), they listed six gases to be counted: carbon dioxide, methane, nitrous oxide, HFCs, PFCs and SF6. The Doha Amendment later added a seventh, nitrogen trifluoride (NF3), for the second commitment period from 2013 to 2020. To add them up fairly, each gas is converted into CO2 equivalent (CO2e), the amount of CO2 that would cause the same warming.
Why this matters. Prelims likes the Kyoto basket and questions such as "Which agricultural practice releases methane?" For Mains, linking each source to a solution (renewable energy, efficient cooling, better rice cultivation, balanced fertiliser use, forest protection) gives you a ready-made "way forward".
Latest numbers (refreshed yearly)
These numbers change, so they are kept in one place and refreshed with the date and source.
- CO2 at Mauna Loa: 426.07 ppm, the monthly average for September 2026 (checked on 16 November 2026).
- Global CO2: 426.10 ppm, the monthly average for July 2026.
- Warming so far: 1.09 °C in 2011–2020 over 1850–1900 (IPCC AR6, 2021). The next IPCC assessment will update this.
Compare the CO2 number with about 280 ppm before the Industrial Revolution and about 315 ppm in 1958: that is the whole story of this chapter in three numbers.
Quick revision
- Keeling Curve: Mauna Loa, since March 1958. CO2 about 280 ppm before industrialisation, about 315 ppm in 1958, 410 ppm in 2019.
- IPCC AR6: human influence has warmed the planet "unequivocally"; 1.09 °C warming in 2011–2020 over 1850–1900; sea level up 0.20 m (1901–2018).
- Kyoto basket: CO2, CH4, N2O, HFCs, PFCs, SF6 (+ NF3 under Doha, 2013–2020).
- Feedbacks: extra water vapour and melting ice (lower albedo) make the first warming bigger.