

Module 9 · 12 min read · Free chapter
மக்கள்தொகை: பரவல், அடர்த்தி மற்றும் வளர்ச்சி
People crowd into fertile plains, deltas, coasts and cities and avoid deserts, high mountains and dense forests. Census 2011 counted about 1,210.8 million Indians, with an average density of 382 per sq km. Uttar Pradesh had the most people, Bihar the highest density and Arunachal Pradesh the lowest. India's growth passed through stagnation, steady growth, explosion and slowing phases.
Start from zero: why count and map people?
Every school, hospital, road, ration shop and parliamentary seat is planned according to how many people live in a place. That is why countries count their people in a census. India's census has been held every ten years since 1881, and the last full count, in 2011, recorded about 1,210.8 million people.
Geographers ask three simple questions about these numbers: where people live (distribution), how crowded a place is (density) and how fast the population is changing (growth). The answers depend on nature, such as land, water and climate, and on human factors, such as jobs, history and health care.
India is a giant on this map. It has about 2.4 per cent of the world's land but around one-sixth of its people, and according to United Nations estimates it became the world's most populous country in 2023.
Why it matters. Population shapes demand for food, water, jobs and housing, and it shapes political representation. Every other topic in human geography, from migration to cities, starts here.
Why people live where they do
People are spread very unevenly across the Earth. About 90 per cent of the world's people live on roughly 10 per cent of its land. Four great clusters stand out: East Asia, South Asia, Europe and eastern North America. Huge areas such as the Sahara, the Arabian desert, the Amazon rainforest, Siberia, Greenland and Antarctica are almost empty.
Three groups of factors explain this pattern. Geographical factors come first: people prefer flat land, fertile soils, a reliable supply of fresh water and a moderate climate. River plains and deltas, such as those of the Ganga, the Nile and the Yangtze, have supported dense populations for thousands of years, while very hot, very cold, very dry or very steep lands repel settlement.
Economic factors can override nature. Mineral deposits draw miners to harsh places, as in the Katanga copper belt or the gold fields of South Africa. Industries, ports and, above all, cities create jobs that attract people, so even deserts can host big populations when oil or trade brings money, as in the Gulf cities.
Social, cultural and historical factors also matter. Some places attract people because of religious or cultural significance, while political instability, wars and poor services push people away. Places with a long history of settlement, such as the old river civilisations, tend to stay crowded.
In India, the same logic applies. The Ganga plains, the coastal plains and the deltas are crowded, while the high Himalaya, the Thar desert and the forested hills of the North-East and central India are thinly peopled.
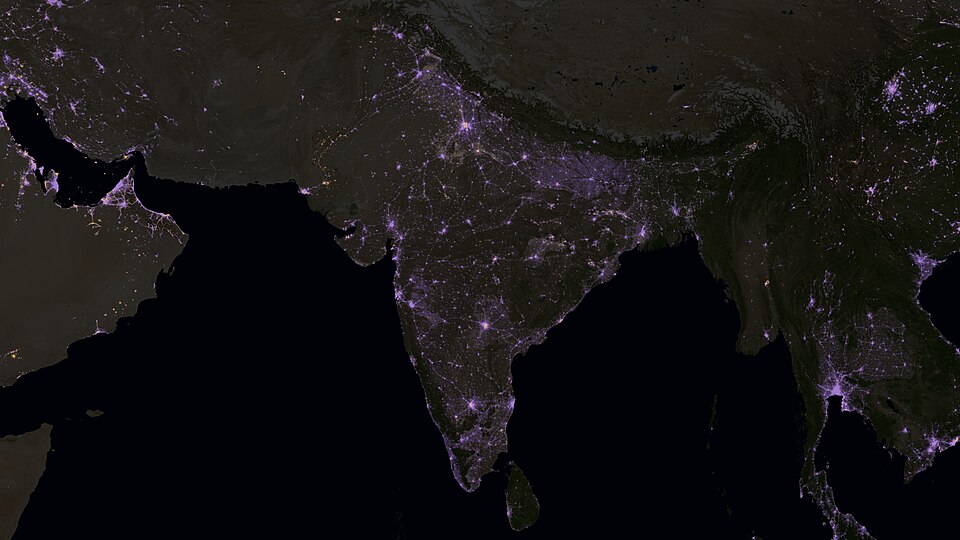
Why it matters. Understanding why people cluster helps explain pressure on land and water. It also shows why changes in jobs and transport can redraw the population map.
Measuring crowding: density
Density tells us how crowded a place is. The simplest measure is arithmetic density: the total population divided by the total area, expressed as persons per square kilometre. In Census 2011, India's density was 382 persons per sq km, up from 325 in 2001, and among the highest of any large country.
But arithmetic density can mislead, because not all land can feed people. Physiological density divides the population by the cultivable land, so it shows the pressure on farmland. Agricultural density divides only the farming population by the cultivable land, and a high value means many farmers share little land, a sign of small holdings and rural underemployment.
Density varies enormously across India. In Census 2011, Bihar had the highest density, above 1,100 per sq km, followed by West Bengal and Kerala, while Arunachal Pradesh had the lowest, below 20 per sq km. Among Union Territories, Delhi was by far the most crowded.
These differences follow geography. The fertile, well-watered Ganga plains and the coastal plains of Kerala and West Bengal support dense rural populations, while the Himalaya, the North-East hills and the Thar have rugged terrain, harsh climate or poor soils. Uttar Pradesh had the largest total population and Sikkim the smallest, but total numbers and density are not the same thing.
Why it matters. Density reveals pressure on land, water and services. It is also a common source of Prelims questions on state rankings and of Mains questions on regional imbalance.
How India's population grew
Population growth is the change in the number of people over time. It depends on the birth rate, the death rate and migration. The difference between births and deaths is called natural growth, and for India as a whole it explains almost all growth.
India's growth in the twentieth century falls into four phases. From 1901 to 1921, the population was almost stagnant, because famines, epidemics such as plague and the 1918 influenza, and poor health care kept death rates very high. The population actually fell slightly in 1911–21, so 1921 is called the "year of the great divide".
From 1921 to 1951, growth was steady, as better sanitation, health care and transport to move food during shortages brought death rates down. From 1951 to 1981, India saw a population explosion: death rates fell sharply with modern medicine and development, while birth rates stayed high, so growth exceeded 2 per cent a year.
From 1981 to 2011, growth remained high but slowed steadily, as birth rates began to fall with rising education, especially of women, age at marriage and the use of family planning. The decadal growth rate dropped to about 17.7 per cent in 2001–2011, the lowest since Independence.
Growth differs sharply between regions. Kerala, Tamil Nadu and other southern states, with high literacy and good health care, reached low fertility early, while large northern states such as Bihar and Uttar Pradesh still grow faster. Nationally, the total fertility rate has now fallen to around the replacement level of 2.1, and India overtook China as the world's most populous country in 2023.
These regional gaps have political consequences. The number of Lok Sabha seats given to each state has been frozen on the basis of the 1971 census until after the first census taken after 2026, partly so that states which slowed their growth are not penalised. How seats are redrawn after that is a sensitive federal question.
Why it matters. Uneven growth affects jobs, resources and even political representation between states. It is also central to debates on delimitation and the demographic dividend.
Theories of population growth
In 1798, the English economist Thomas Malthus warned that population tends to grow geometrically (1, 2, 4, 8, 16), while food supply grows only arithmetically (1, 2, 3, 4, 5). Sooner or later, he argued, people would outrun food, and "positive checks" such as famine, disease and war would cut numbers, unless people used "preventive checks" such as late marriage and restraint.
History did not follow Malthus exactly. Technology, especially the agricultural revolution and later the Green Revolution, raised food output far faster than he expected, and birth rates fell on their own in many countries. Yet his warning still echoes in concerns about land, water and climate limits, which is why modern thinkers called neo-Malthusians still raise it.
A more widely used explanation is the demographic transition model. It describes how a society moves through stages. In stage 1, birth and death rates are both high, so the population barely grows. In stage 2, death rates fall quickly due to better food, sanitation and medicine, while birth rates stay high, so the population explodes.
In stage 3, birth rates also begin to fall, as education, urbanisation and family planning spread, so growth slows. In stage 4, both rates are low and the population is nearly stable, and some theorists add a stage 5 in which birth rates fall below death rates and the population starts to shrink, as in Japan and parts of Europe. India is in the later part of stage 3, with falling fertility but still a large young population.
That young population is an opportunity. A high share of working-age people can produce a demographic dividend, but only if they are healthy, educated, skilled and employed; otherwise it becomes a burden.
Why it matters. These models help explain India's past and future, and they frame policy debates on family planning, education and jobs. They are a staple of both Prelims and Mains.
Population and policy: from control to welfare
India was one of the first countries in the world to launch an official family planning programme, in 1952. Early efforts focused on targets and, during the Emergency of the mid-1970s, coercive sterilisation drives created a strong backlash. Since then, policy has moved away from targets towards voluntary choice, health and welfare.
The National Population Policy 2000 set goals of reducing infant and maternal mortality, ensuring universal immunisation and schooling, raising the age at marriage and meeting the unmet need for contraception. The experience of Kerala and Tamil Nadu showed that women's education, health care and economic opportunity reduce fertility more effectively than coercion.
Today the challenge is changing. Southern and western states have fertility below replacement and are beginning to age, while some northern states are still young and growing. India must plan for both: jobs and skills for a huge young workforce and pensions and health care for a growing elderly population.
Why it matters. Population policy links geography with health, gender and economics. A balanced Mains answer stresses rights-based approaches and regional differences rather than numbers alone.
Mains lens: what, why, where and so what
This chapter supports GS Paper I (population and associated issues; salient features of Indian society) and links to GS Paper II and III on welfare, health and the economy. Here are four angles.
1. Distribution logic. Physical, economic and historical factors together explain crowding and emptiness.
2. Phases and regions. India's growth phases and the north–south gap explain today's demographic diversity.
3. Theory to practice. The demographic transition and Malthus help evaluate claims of overpopulation.
4. Dividend or burden. Education, health and jobs decide whether a young population becomes an asset.
Mains lens: practice questions and answer plans
Now turn this understanding into written answers. The four questions below are written in the UPSC style, but they are our own practice questions, not previous-year questions. The real previous-year questions of your exam appear in the "Previous year questions" box once we have matched them with the official papers.
Q1. "Discuss the factors responsible for the uneven distribution of population in India." (250 words)
- Introduction: Density contrasts from Census 2011.
- Body: Physical, economic and socio-historical factors with regional examples.
- Conclusion: Implications for planning.
Q2. "Trace the phases of population growth in India during the twentieth century." (150 words)
- Cover the four phases and 1921.
- Explain the role of birth and death rates.
Q3. "Where does India stand in the demographic transition, and what are its implications?" (150 words)
- Describe the stages and India's position.
- Link to the demographic dividend and ageing states.
Q4. "Is Malthus still relevant? Examine with reference to India." (150 words)
- Cover the theory and why history diverged.
- Weigh resource limits and climate stress today.
Useful keywords: census, distribution, arithmetic density, physiological density, agricultural density, year of the great divide, population explosion, decadal growth, natural growth, total fertility rate, replacement level, demographic transition, Malthus, positive and preventive checks, demographic dividend, ageing, regional divergence.
Quick revision
- About 90 per cent of people on about 10 per cent of land; four clusters: East Asia, South Asia, Europe, eastern North America.
- Densities: arithmetic (total area), physiological (cultivable land), agricultural (farm population ÷ cultivable land).
- Census 2011: 1,210.8 million; density 382; decadal growth about 17.7 per cent.
- Most populous: Uttar Pradesh; least: Sikkim. Highest density: Bihar; lowest: Arunachal Pradesh.
- Phases: 1901–21 stagnant; 1921–51 steady; 1951–81 explosion; 1981–2011 slowing. 1921 = year of the great divide.
- Demographic transition: high–high → falling deaths → falling births → low–low; India late stage 3.
- Malthus 1798: population geometric, food arithmetic; positive and preventive checks.
- India most populous country since 2023 (UN).